Site-Specific Nutrient Management
Zone soil sampling as a practical method for directing variable rate nitrogen applications in North Dakota.
|
|
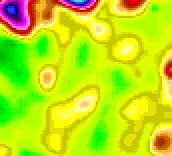
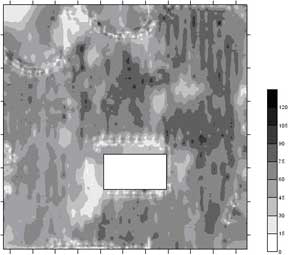
Figure 1. Nitrate-N at Valley City , ND in 1994 after wheat and 1995 after sunflowers. Similar patterns are seen in each year, and stimulated to move to a zone approach to sampling for variable-rate N application. |
I grid-sampled fields most of my agricultural career, first as an agronomist for a fertilizer retailer, then as a graduate student. When I came to North Dakota in 1994 I had no other thought but to repeat the work that I had done on grid sampling in Illinois. I thought that I would probably come up with the same answer regarding grid size as we had derived earlier; one sample per acre was needed to show fertility patterns in a field. The first year that I sampled I was pleased to see that the field we happened to work in showed a very distinctive pattern of nitrate levels. However, I expected the pattern to be different the next year because I was always told that nitrate levels changed. My view of the world, at least in regards to sampling, changed when I sampled the same field again the next fall and saw similar patterns as the previous year (Figure 1).
The only explanation for seeing similar patterns in two successive years following two different crops (wheat the initial year, sunflower the next) was that there was some underlying physical and logical reason why nitrate levels tended to be consistently high or low in certain areas. It seemed logical from our short experience in that field that landscape, or topography, might have something to do with residual soil nitrate patterns.
We measured the elevation using a standard surveyors transit. After overlaying the topography surface map with nitrate levels, we could see that the higher nitrate areas were in depressions and lower nitrate areas were on the sandier ridges (Figure 2). Our statistical analysis showed that if we divided the field into five topographic zones, then we could give a similar or better representation of nitrate levels as a one sample per acre grid.
Since 1994, nitrate has been related to topographic zones each year we have studied this field. It is logical that topography and nitrate are related because topography helps control the movement of water through the soil. Since nitrate is an anion and is very soluble in water, nitrate readily moves with soil water. Water always moves to the same places within a field. Depressions receive the most surface water, and also have the highest water table. Hilltops shed the most water, and therefore less water enters the soil to leach nitrate. Slopes are usually somewhere in-between.
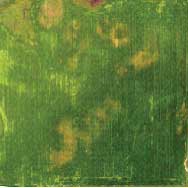
There are other methods that have been investigated that help delineate the boundaries for nitrogen management zones. One of the most commercially successful applications has been the use of remote imagery in sugarbeet to site-specifically reduce N applications to the following crop using sugarbeet leaf color. North Dakota State University soil scientist Dr. John Moraghan related sugarbeet leaf color at harvest with nitrogen credit potential. This principal is being used to delineate zones using satellite imagery. The foliage color is ground-truthed by sugar company field agriculturalists. The grower can then have a fertilizer spreading map developed to site-specifically reduce N applications to parts of the fields. Satellite imagery can be used in other crops as well, such as wheat (Figure 3).
Other methods that have been found useful are aerial photographs of the growing crop (Figure 4), electrical conductivity sensors (Figure 5) and yield mapping (Figure 6). Our current research is looking at ways to automate the zone delineation process and determine whether one method, or a combination of methods provides greater reliability than just a single method.
| Figure 5. Soil electrical conductivity of the Valley City field. Readings taken using a Veris® EC sensor. | Figure 6. Barley yields, 2002. Square area in the center is an internal study not associated with the rest of the field. Yields are in bushels per acre on the scale bar. |